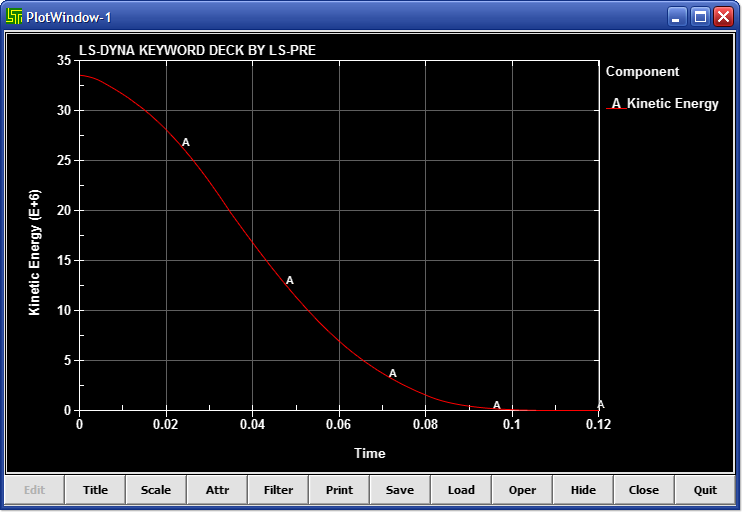
- Figure 1 – XYPlot Interface
- Left and Right Menus (Common)
- Right Menu
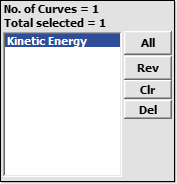
- Figure 2 – Left Menu
Select all curves in the list
Reverse curve selection
Clear curve selection
Remove selected curve from list
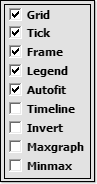
 Grid – Add/remove grid lines in XY-Plot window
- Tick – Add/remove tick marks in XY-Plot window
- Frame – Add/remove frame in XY-Plot window
- Legend – Add/remove legend in XY-Plot window
- Autofit – Toggle Automatically Fit data in XY-Plot window (on/off)
 Timeline – Toggle time line in XY-Plot window
- Invert – Invert background color in XY-Plot window
- Maxgraph – Use all of XY-Plot window to display data
- MinMax – Add/remove min/max label in XY-Plot window
This function has been deprecated.

 after – edit point after current
 before – edit point before current
Set and change titles/axis labels
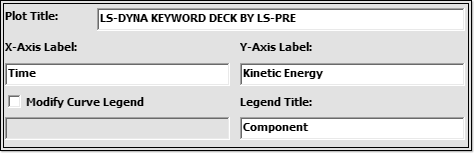
- Figure 4 – XYPlot Title
- Plot Title: Input plot title
- X-Axis label: Input x-axis label
- Y-Axis label: Input y-axis label
- Modify Curve Legend – Modify name in legend
- Legend Title: Input legend title
Set and change offset/scale of curves
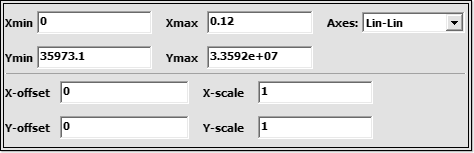
- Figure 5 – XYPlot Scale
- Xmin: Input min value for x-axis
- Xmax: Input max value for x-axis
- Ymin: Input min value for y-axis
- Ymax: Input max value for y-axis
- Axes: Select logarithmic/linear scale
- X-offset: Input offset value for X-axis
- Y-offset: Input offset value for Y-axis
- X-scale: X axis scale factor
- Y-scale: Y axis scale factor
Change attributes of XY-Plot
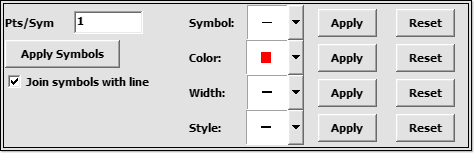
- Figure 6 – XYPlot Attr
- Pts/Sym: Input # of points per symbol
- Join symbols with line – Toggle lines between symbols
- Symbol: Select symbol style
- Color: Select curve and symbol color
- Width: Select line width
- Style: Select line style
Apply individual changes
Reset individual changes
Set curve filtering
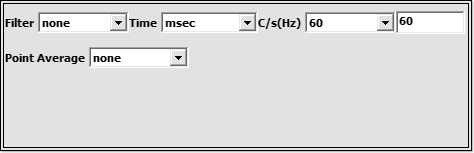
- Figure 7 – XYPlot Filter
- Filter: Select filter to apply
- Time: Select time units
- C/s(Hz): Select/Enter frequency
- Point Average: Select number of points to average
- (example, PA=3: avg of ordinate values taken every
- 3 points, and all 3 points are given the avg value)
Open print dialog
- See Print Dialog information under the File Menu
Write XY-Plot data to a file
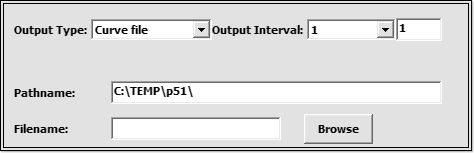
- Figure 8 – XYPlot Save
- Output Type: Select data output type
- Output Interval: Select/Enter # of time steps between outputs
- Pathname: Enter path to file save location
- Filename: Enter filename
Browse to select file save location
Write XY-Plot data to given filename
Load XY-Plot data from a file
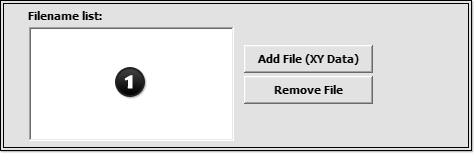
- Figure 9 – XYPlot Load
- Filename list: Select file to show stored data

Add a file to the filename list
Remove a file from the filename list
Open selected data files
Process XY-Plot data
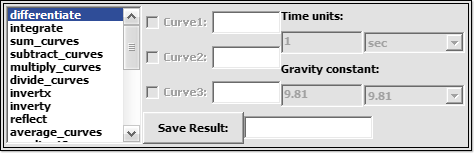
- Figure 10 – XYPlot Oper
- Operations List: Select operation to apply
- Curve 1 – Pick/Enter first curve for operation
- Curve 2 – Pick/Enter second curve for operation
- Curve 3 – Pick/Enter third curve for operation
- Time Units: Select/Enter HIC time units
- Gravity Constants: Select/Enter HIC gravity constants
Save resultant curve as XYPlot data file
- Note: Fast Fourier Transforms will be performed only on data visible in the plot window, so zooming in will effect the results. (this applies to the “fft” and “fft_radix” operations)
Hide buttons (click in window and hit Esc to restore)
Close the plot window
Close and delete plot window from the memory