-
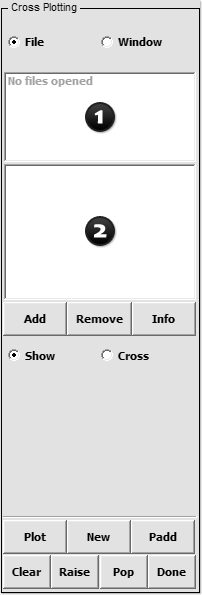
- Figure 1 – Xyplot Interface
Purpose:
This interface is used to control all open XY-Plot windows and files. External XY data can be loaded for plotting and/or cross plotting.
Often there is need to plot force vs. deflection response of structures. This requires a force vs. time curve and a deflection vs. time curve. Cross plotting allows users to select deflection from the deflection vs. time curve for the x-axis and force from the force vs. time curve for the y-axis. If the number of points for the 2 curves is not the same, the data is interpolated.
Cross plotting can also be done from plot read in by using the Add button or from XY-plot windows. For cross plotting data from XY-plot windows, the Window option should be activated (The default is the File option).
The format of external XY data can be in Microsoft CSV format or XY data pairs as shown below. In this example, note how the first line of each curve definition defines the number of XY data pairs that follow:
- 2
- 0.0,0.0
- 10.0,20.0
- 4
- 0.0,0.0
- 30.0,20.0
- 40.0,10.0
- 50,0,10.0
Controls:
 File – Show list of XY-Plot data files
 Window – Show list of current XY-Plot windows
- Select file/window to be shown

- Select XY-Plot to show or to cross plot

Open and add a XY-Plot data file to the filename list
Remove a XY-Plot data file from the filename list
Show full XY-Plot data file path in command window
- Show – Show selected plot
- Cross – Cross selected plots
Plot XY-Plot data in current XY-Plot window
Plot XY-Plot data in a new XY-Plot window
Add XY-Plot data to current XY-Plot window
Clear selected items in list
Raise all open XY-Plot windows
Open and Raise all closed XY-Plot windows
Exit Cross Plotting interface
