lsoptui [command_file.lsopt]
lsoptui.exe
A command file can be opened directly by drag and drop or by double-clicking on the .lsopt filename.
Open the graphical user interface of LS-OPT. Enter the required specifications, to generate an LS-OPT project file, by the following steps:
A window Stage stagename shall open.
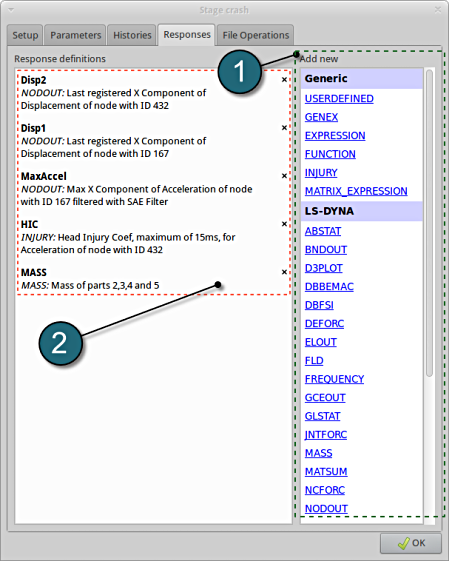
Now define the results to be extracted from the solver output database (to be used as objectives or constraints in the optimization phase) using the interfaces available in the Histories (curve data) or Responses (scalar values) tab, respectively.

A window Problem global setup shall open.
Variables form the input file are automatically displayed.
A window Sampling crash shall open.
The Build Metamodels box is coupled to the same dialog as the Sampling box.
It is displayed at the end of the process to correctly represent the optimization process.
A window Optimization shall open.
A window Termination criteria shall open.
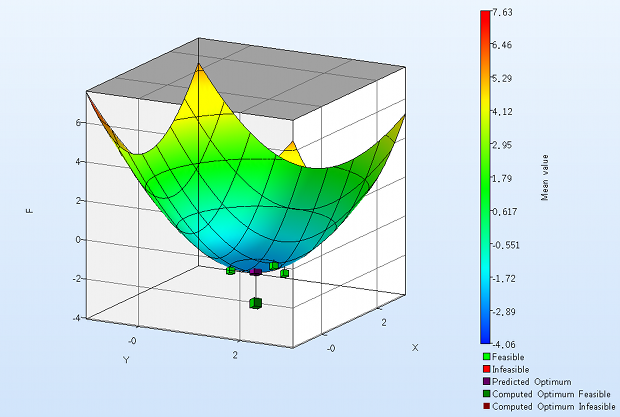
You can plot the metamodel surface you have built. The plot can be zoomed and rotated. You may also add the sampling points (both feasible and infeasible) and the optimum points (predicted and computed) to the plot. This is a visual way to check the results.

Which variable is the most important for a response? The sensitivity analysis shows the influence of all the variables on the selected response. There are two analysis methods to choose.
Progress of a variable, a response or other entities during the optimization process. If the strategy Sequential with Domain Reduction is applied, the blue curves show the shrink of the domain of a variable.